
VISUALS
Maps & Infographics
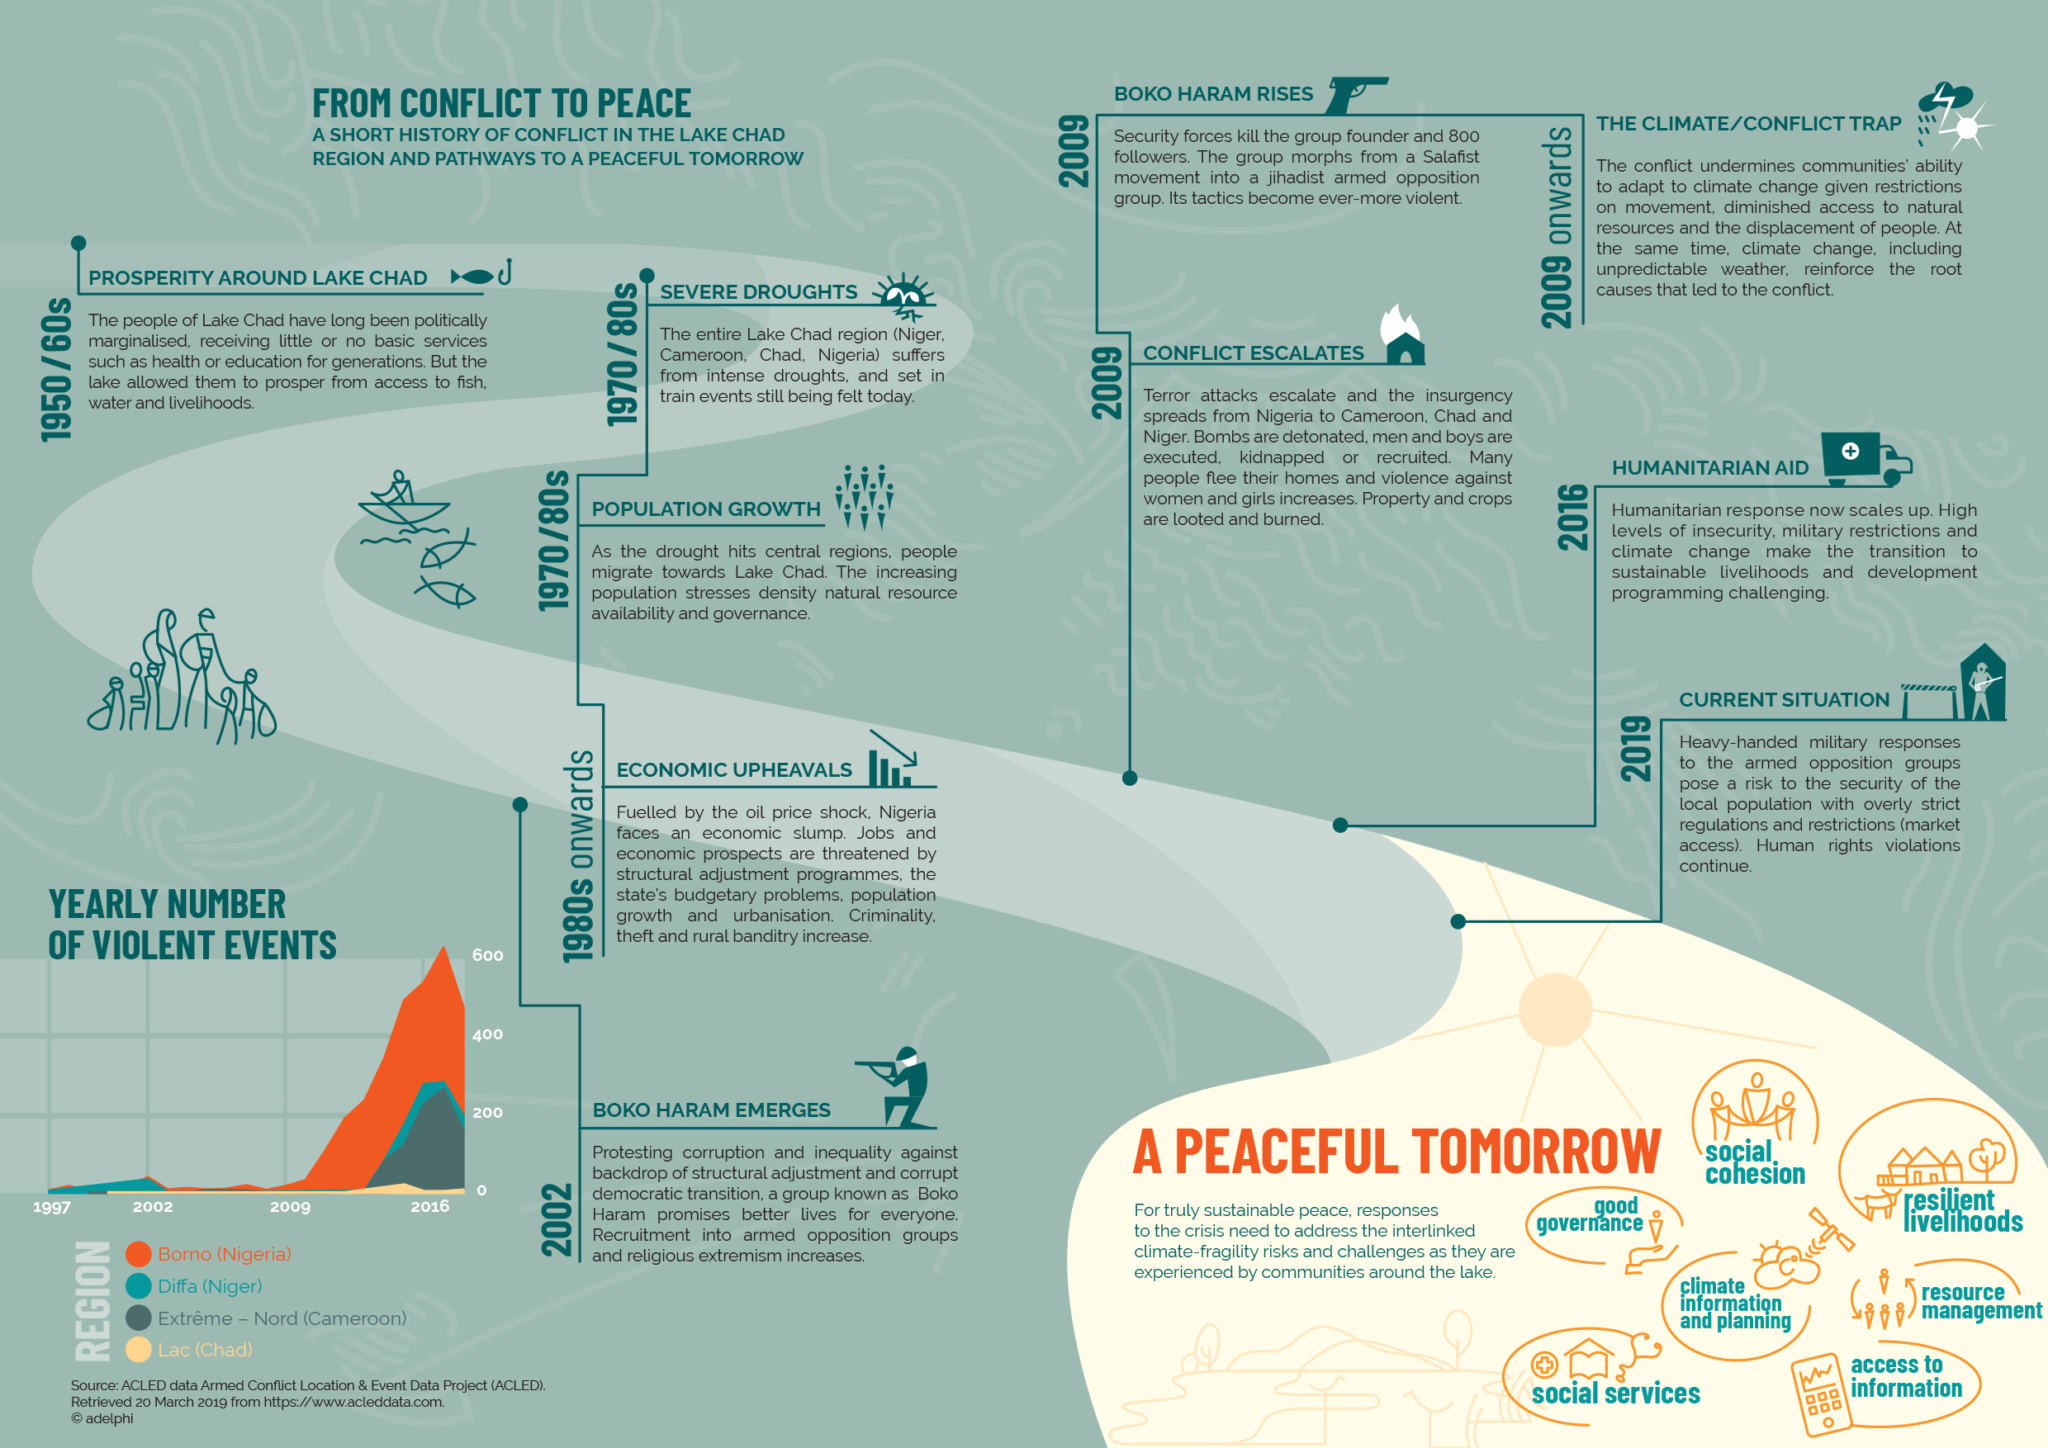
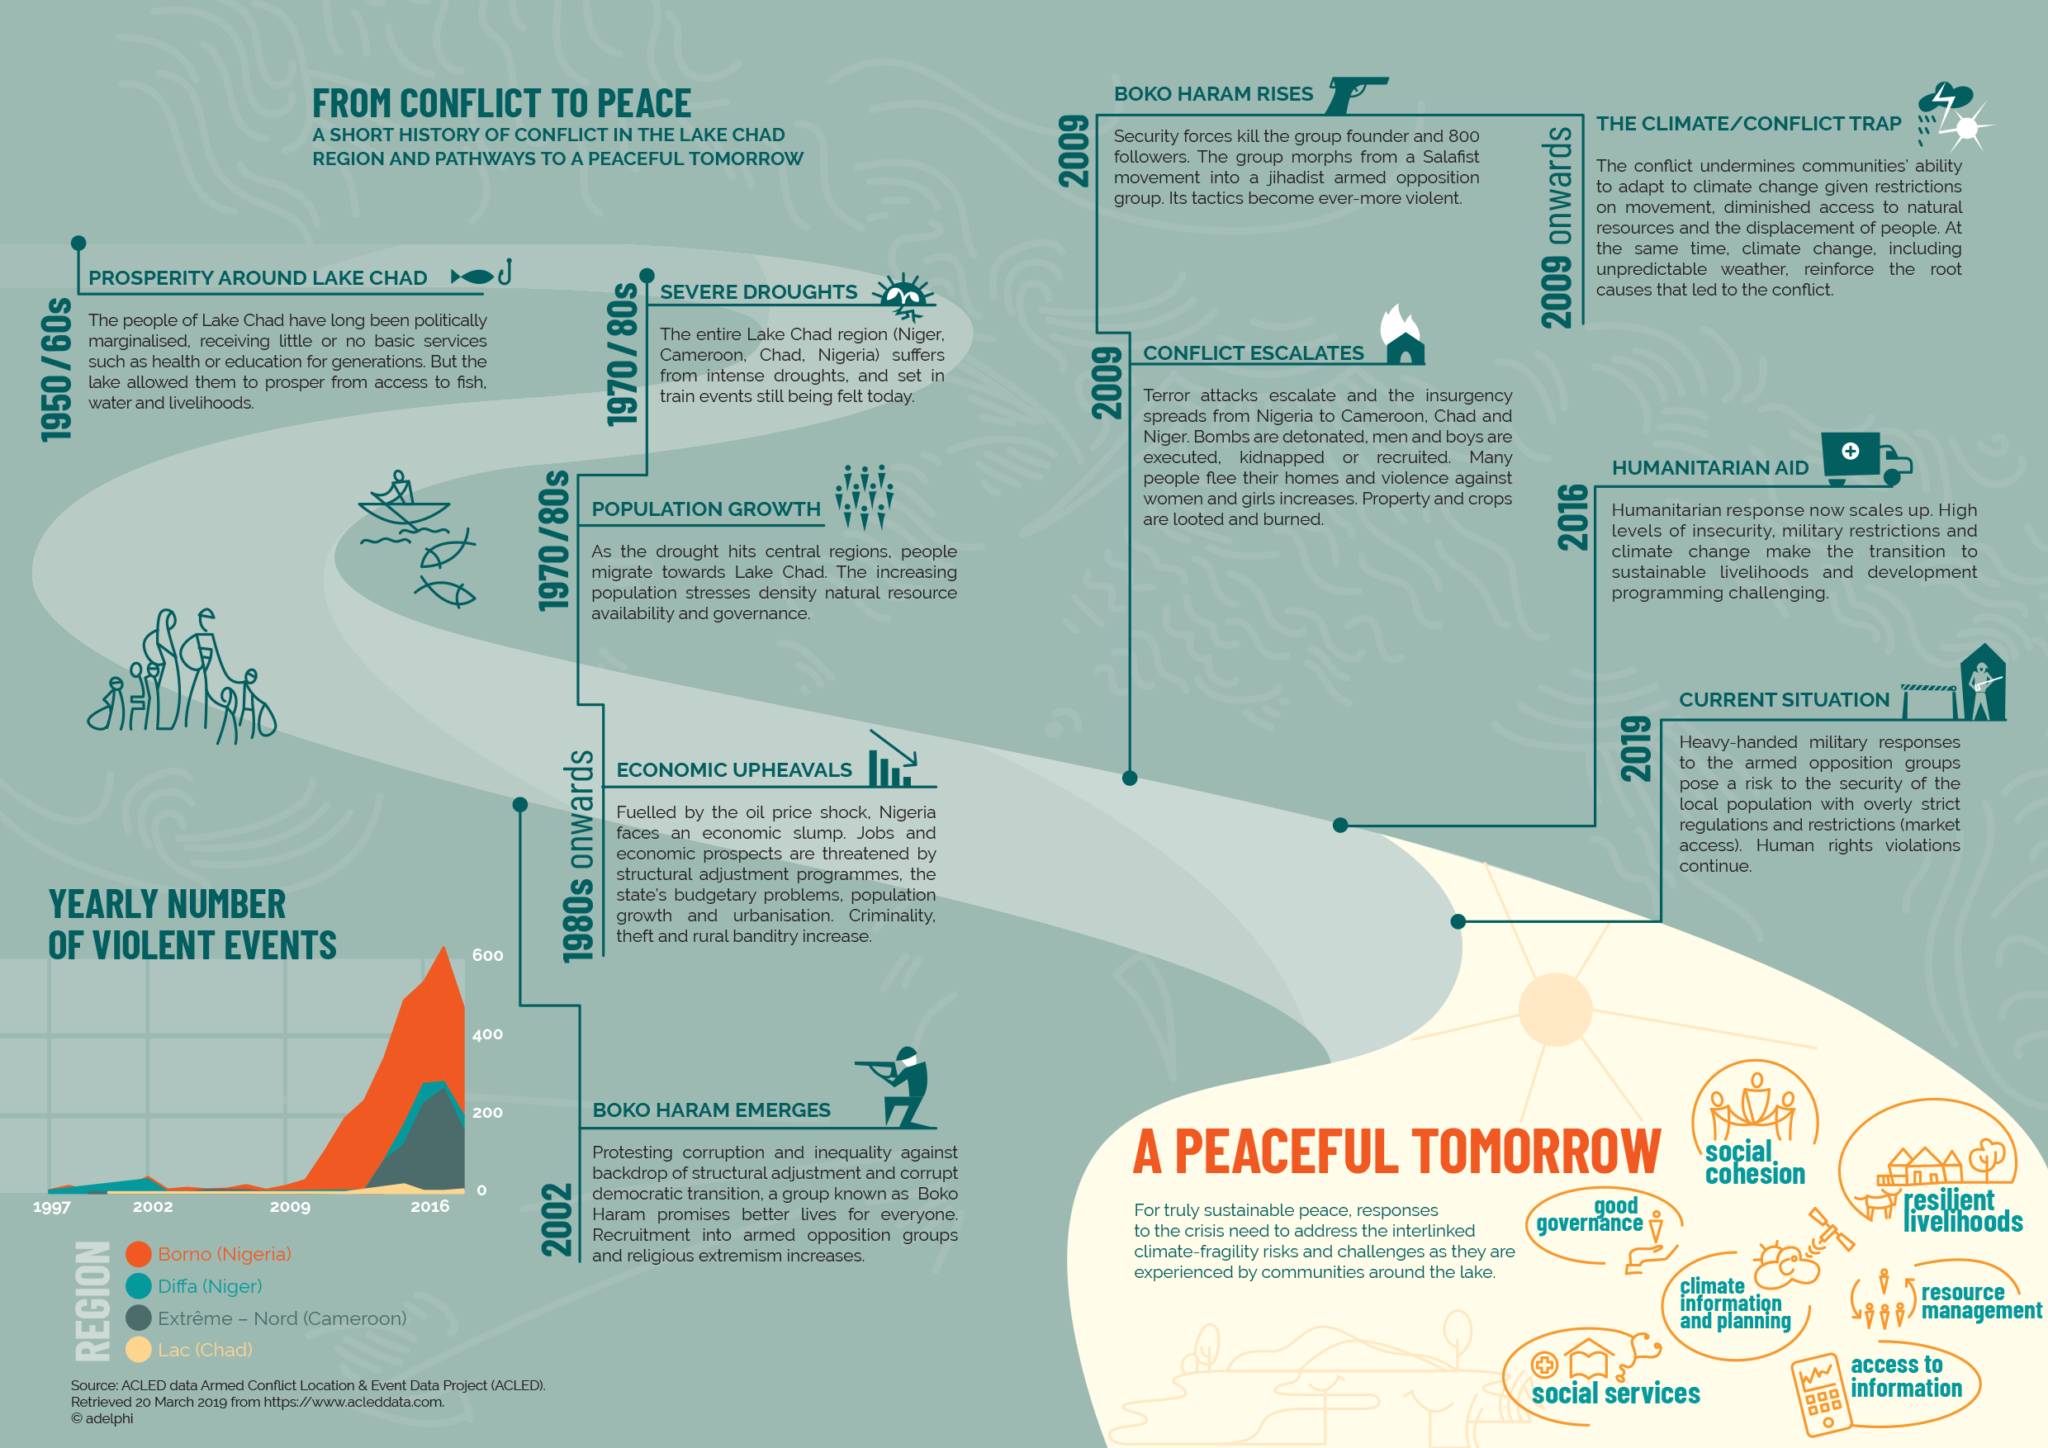
From conflict to peace
| DOWNLOAD JPG 381 KB |
A short history of conflict in the Lake Chad region and pathways to a peaceful tomorrow.
SOURCE
- ACLED data Armed Conflict Location & Event Data Project (ACLED). Retrieved 20 March 2019 from https://www.acleddata.com
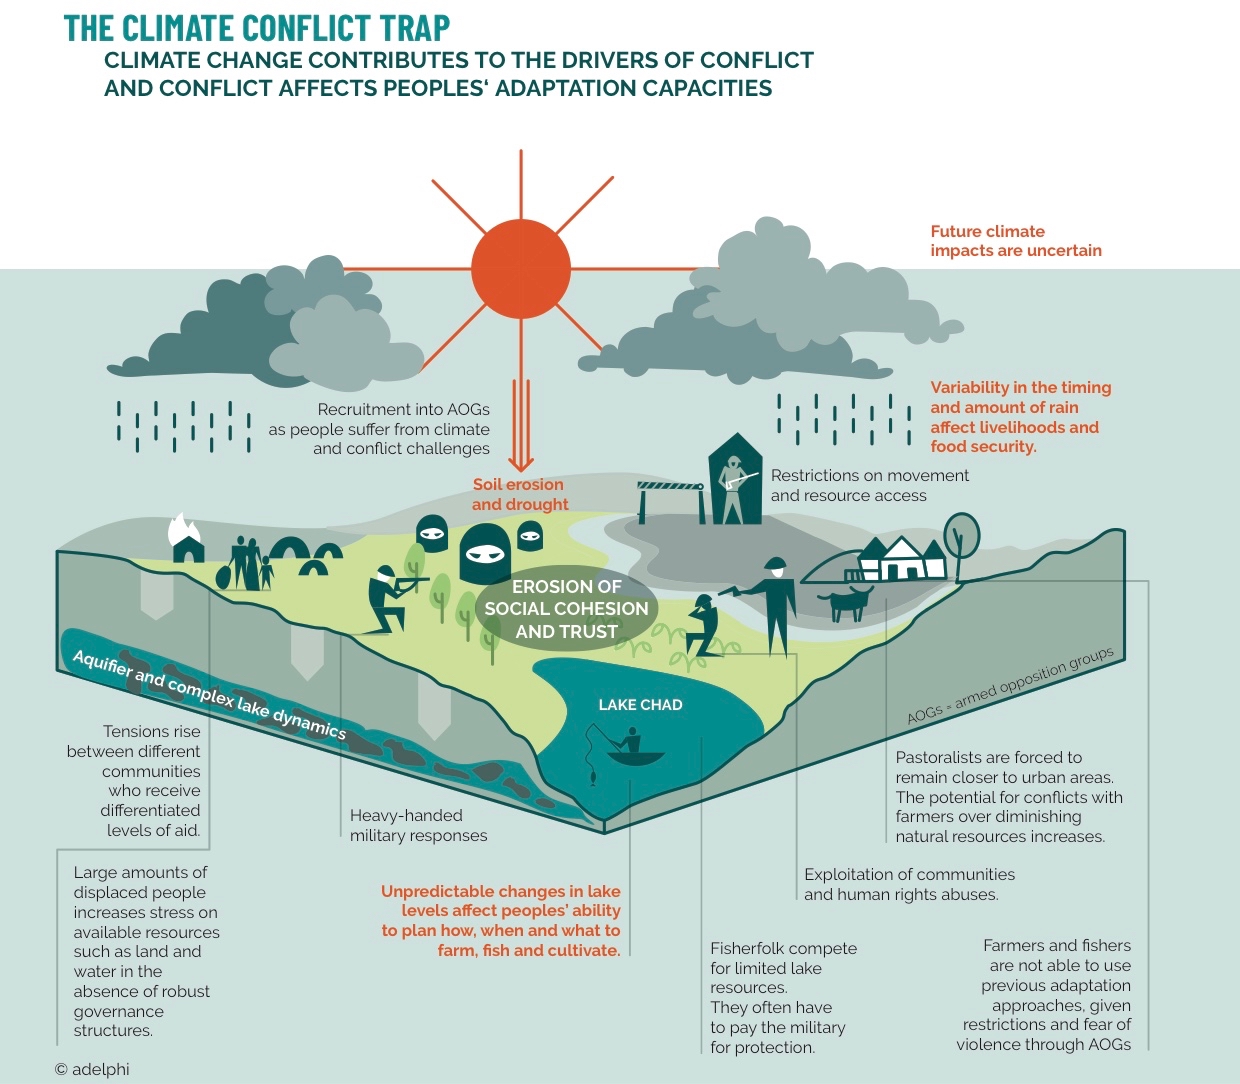
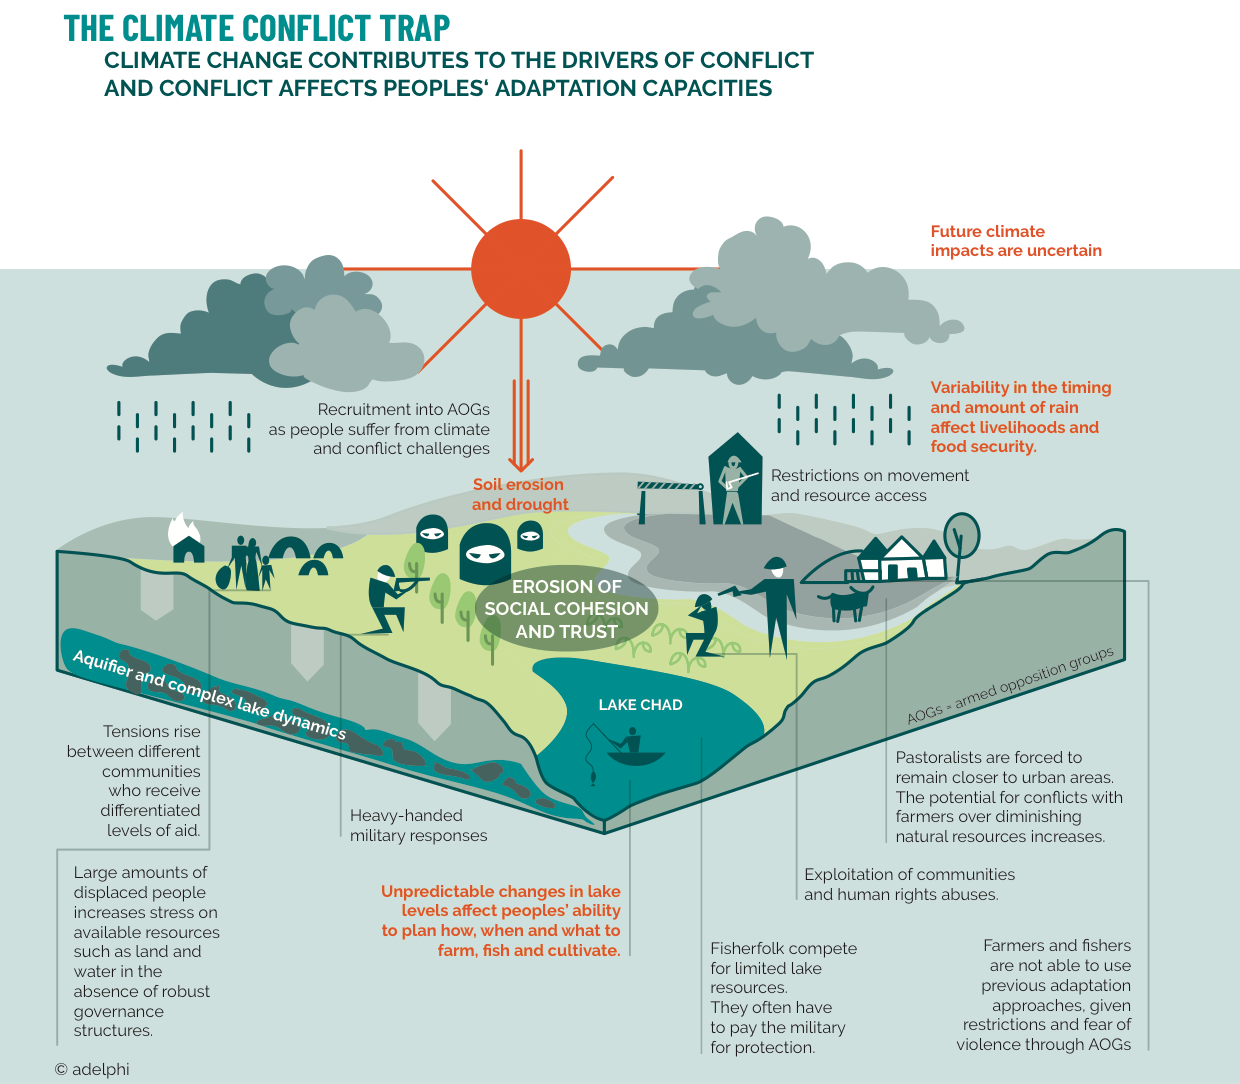
The climate conflict trap
| DOWNLOAD JPG 505 KB |
Climate change contributes to the drivers of conflict and conflict affects peoples‘ adaptation capacities.
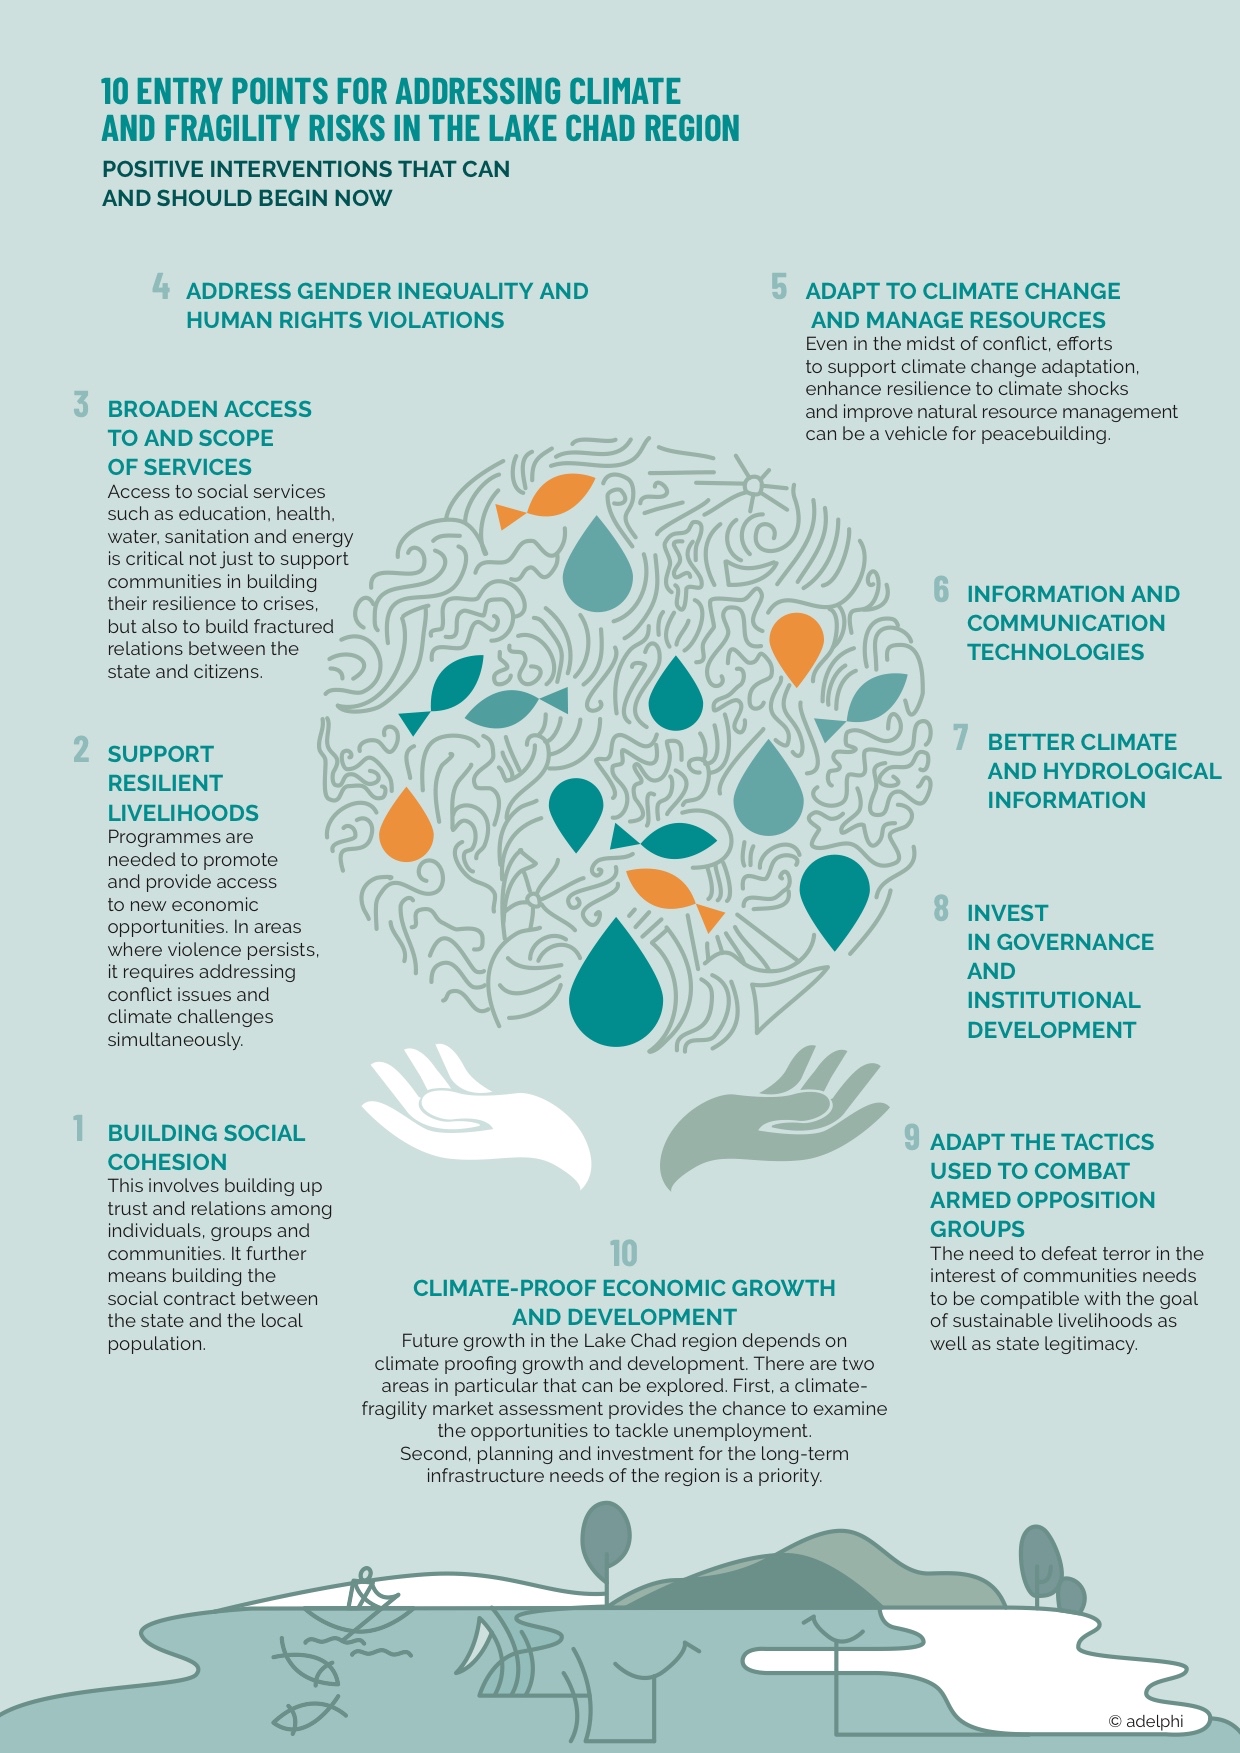
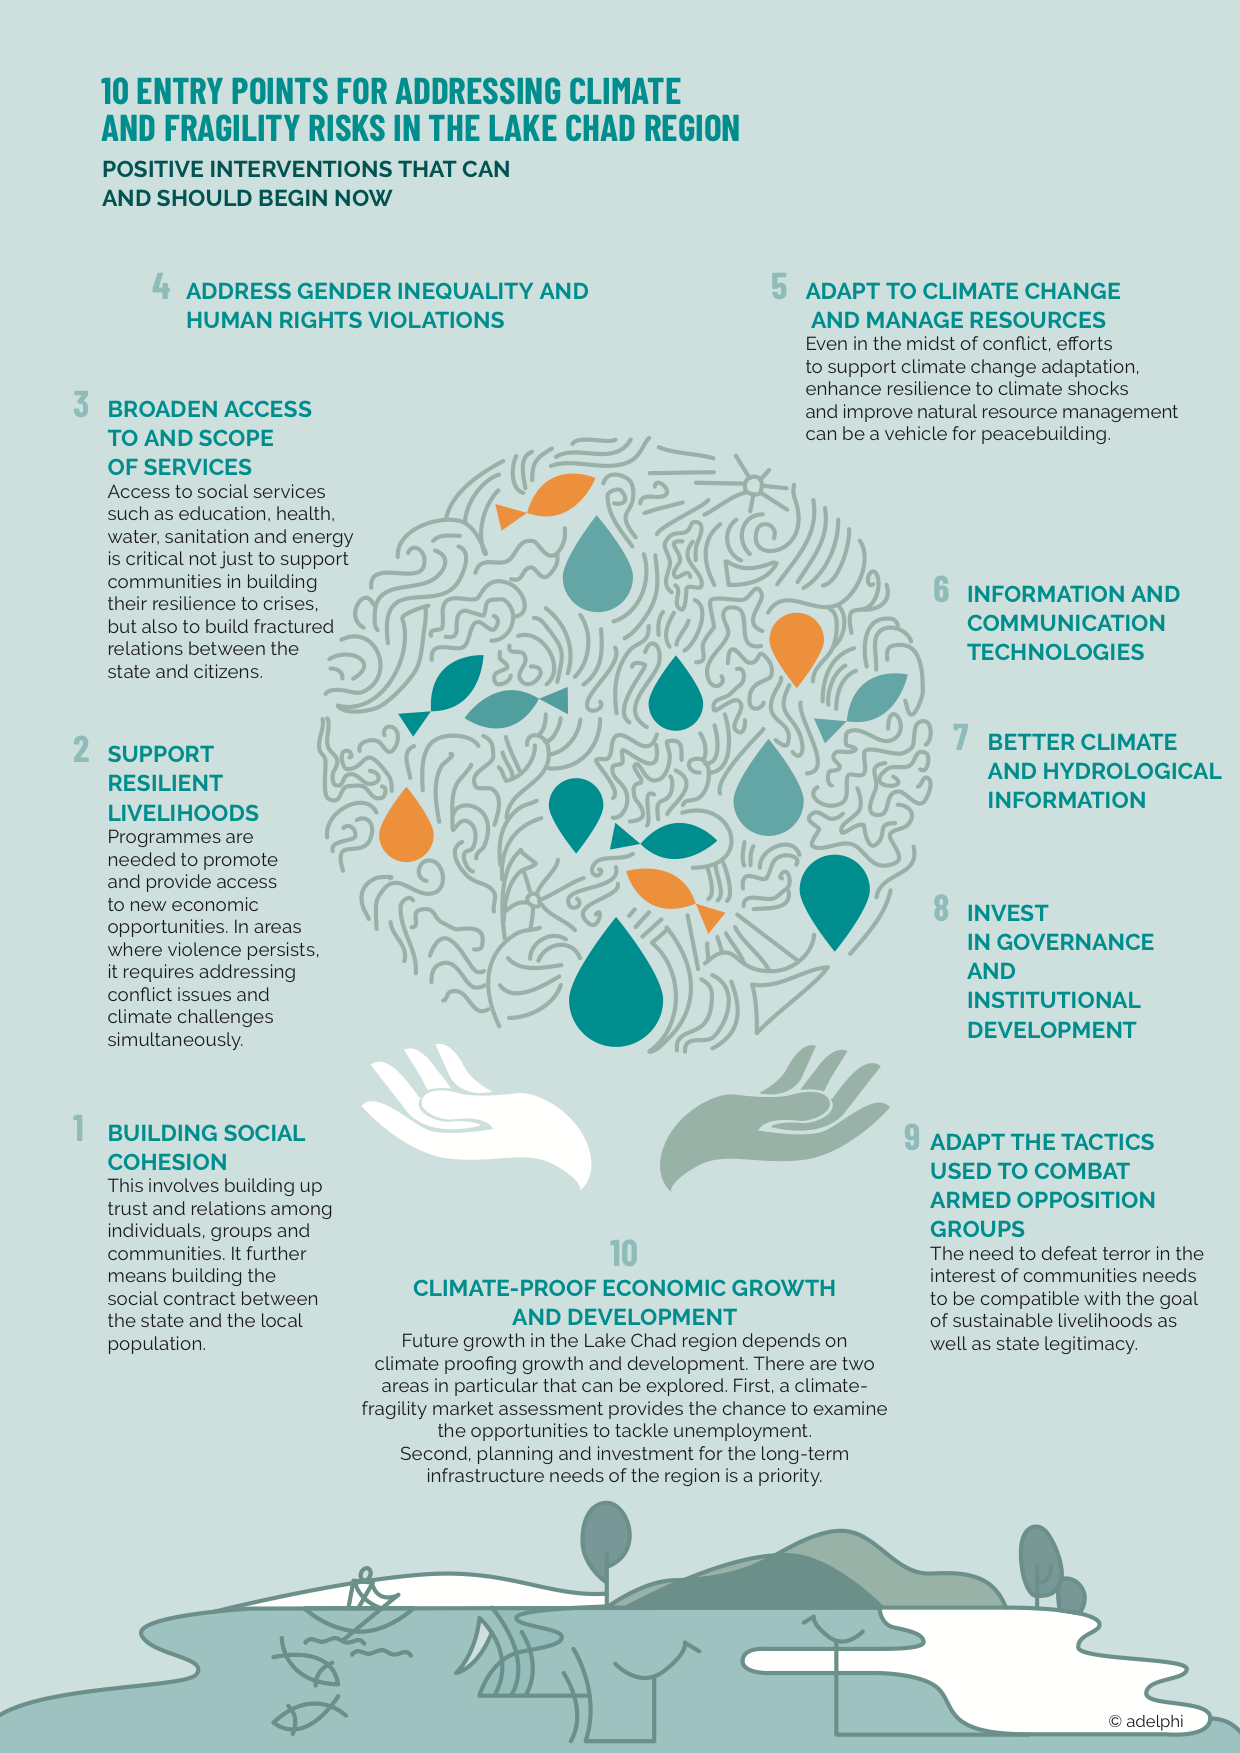
10 entry points for addressing climate and fragility risks in the Lake Chad region
| DOWNLOAD JPG 836 KB |
Positive interventions that can and should begin now.
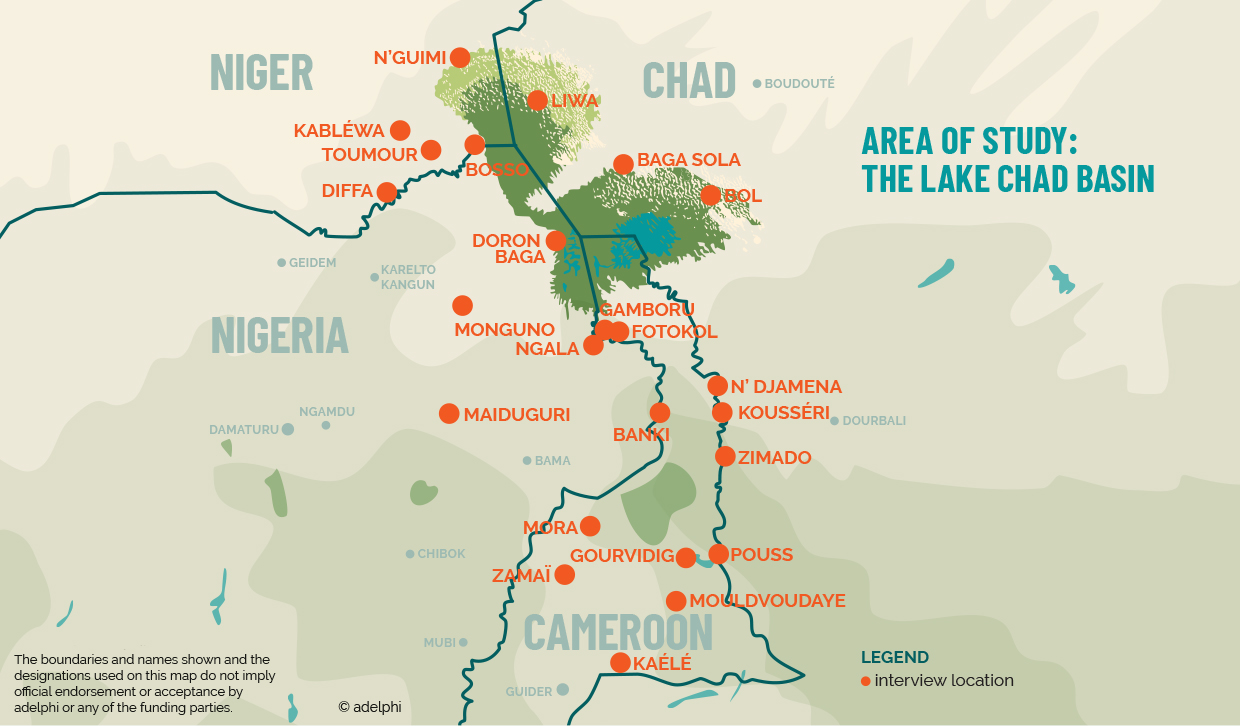
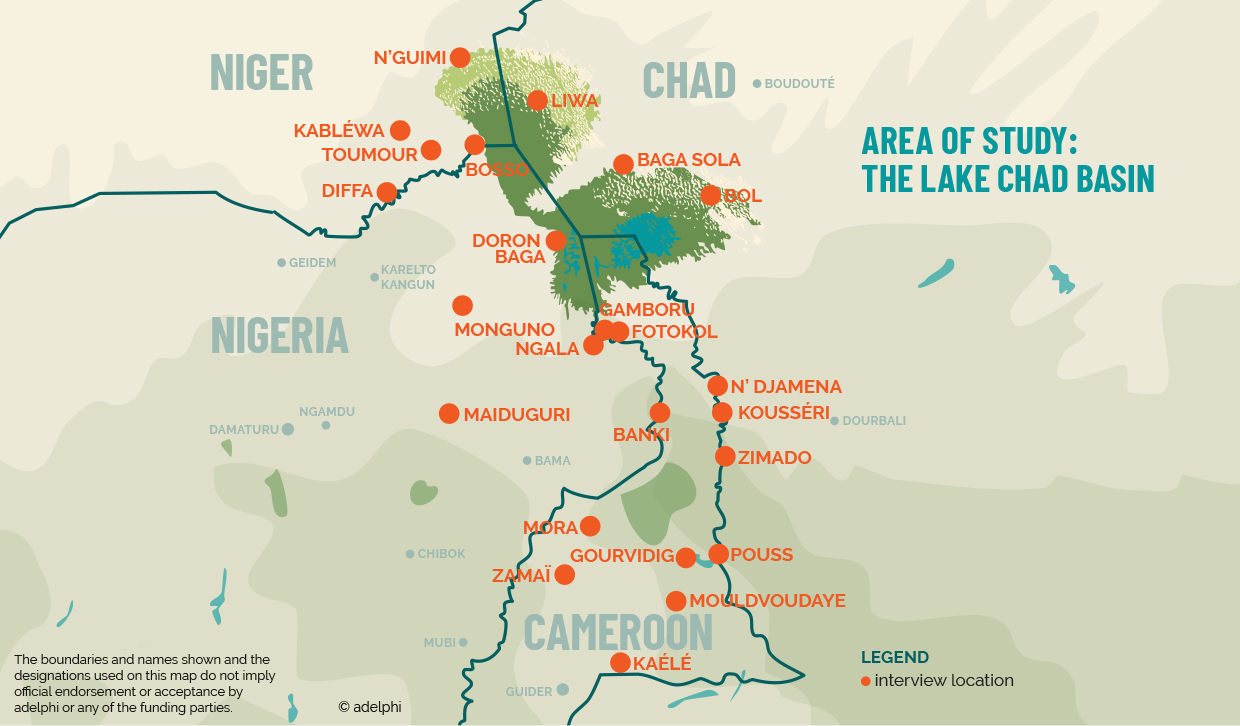
Area of study: the Lake Chad basin
| DOWNLOAD JPG 394 KB |
The boundaries and names shown and the designations used on this map do not imply official endorsement or acceptance by adelphi or any of the funding parties.
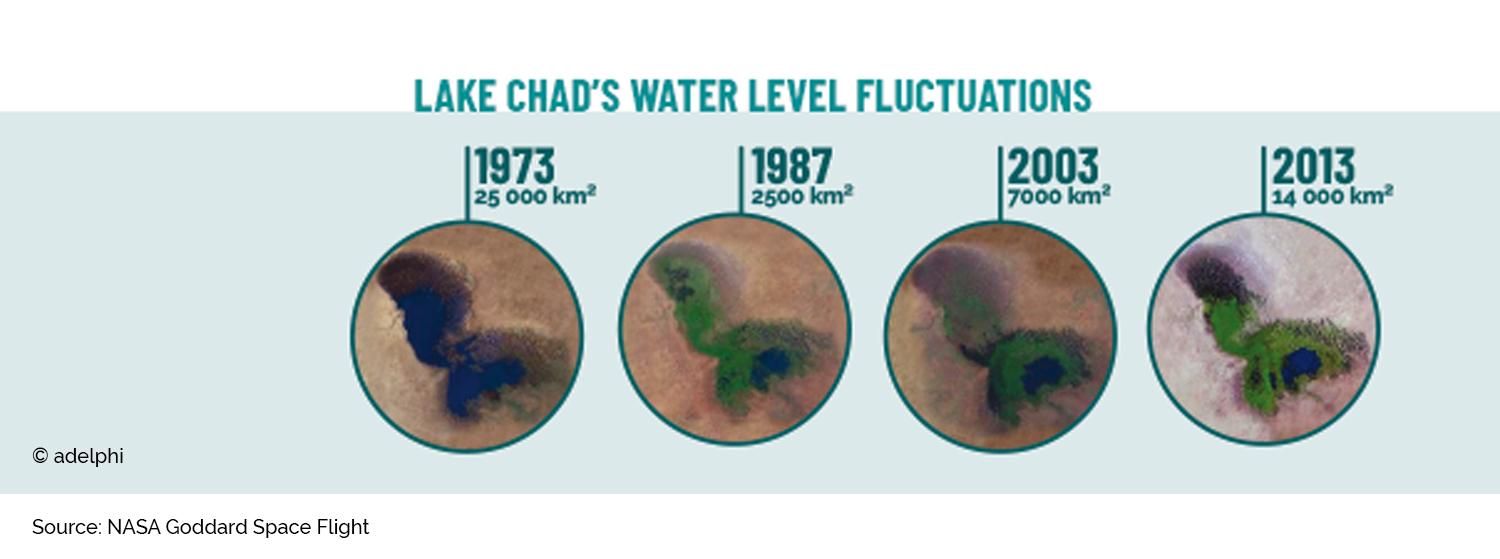
Lake Chad’s water level fluctuations
| DOWNLOAD JPG 224 KB |
SOURCE
- NASA Goddard Space Flight
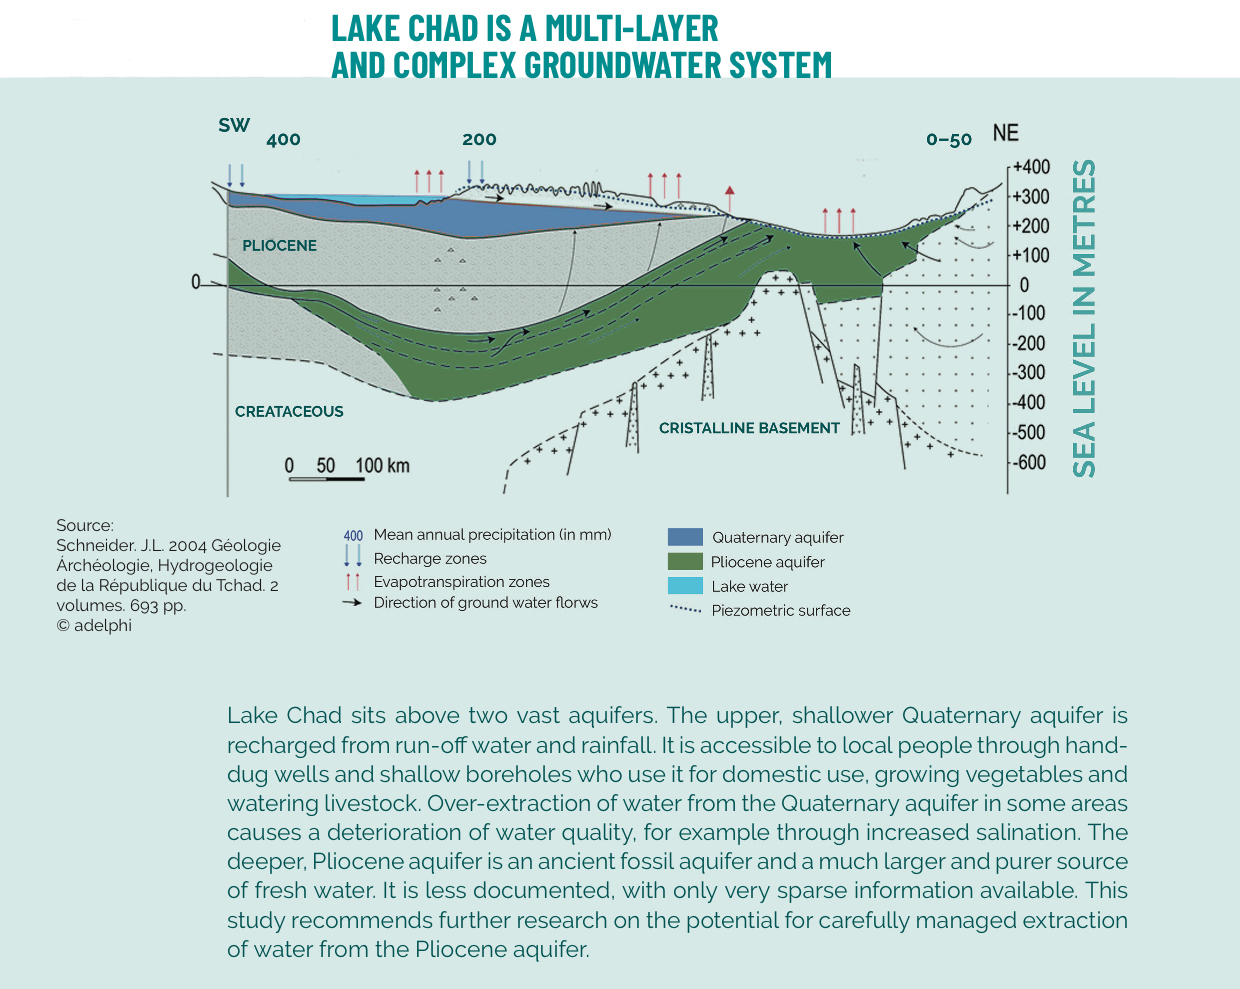
Lake Chad is a multi-layer and complex groundwater system
| DOWNLOAD JPG 683 KB |
Lake Chad sits above two vast aquifers. The upper, shallower Quaternary aquifer is recharged from run-off water and rainfall. It is accessible to local people through hand dug wells and shallow boreholes who use it for domestic use, growing vegetables and watering livestock. Over-extraction of water from the Quaternary aquifer in some areas causes a deterioration of water quality, for example through increased salination. The deeper, Pliocene aquifer is an ancient fossil aquifer and a much larger and purer source of fresh water. It is less documented, with only very sparse information available. This study recommends further research on the potential for carefully managed extraction of water from the Pliocene aquifer.
SOURCE
- Schneider, J.L.. 2004 Géologie, Archéologie, Hydrogéologie de la République du Tchad. 2 volumes, 693 pp.
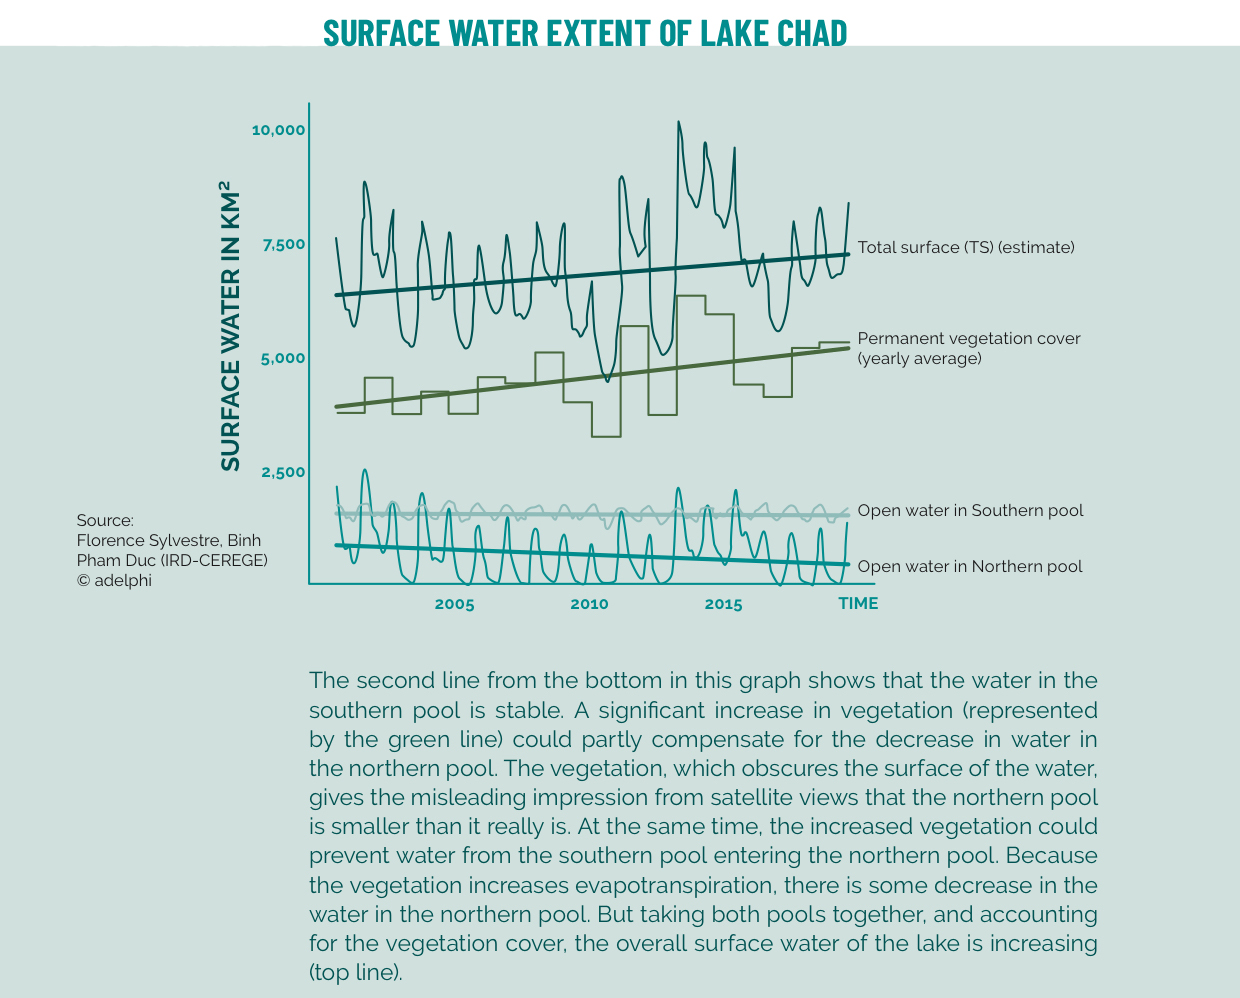
Surface water extent of Lake Chad
| DOWNLOAD JPG 570 KB |
The second line from the bottom in this graph shows that the water in the southern pool is stable. A significant increase in vegetation (represented by the green line) could partly compensate for the decrease in water in the northern pool. The vegetation, which obscures the surface of the water, gives the misleading impression from satellite views that the northern pool is smaller than it really is. At the same time, the increased vegetation could prevent water from the southern pool entering the northern pool. Because the vegetation increases evapotranspiration, there is some decrease in the water in the northern pool. But taking both pools together, and accounting for the vegetation cover, the overall surface water of the lake is increasing (top line).
SOURCE
- Florence Sylvestre, Binh Pham Duc (IRD-CEREGE)
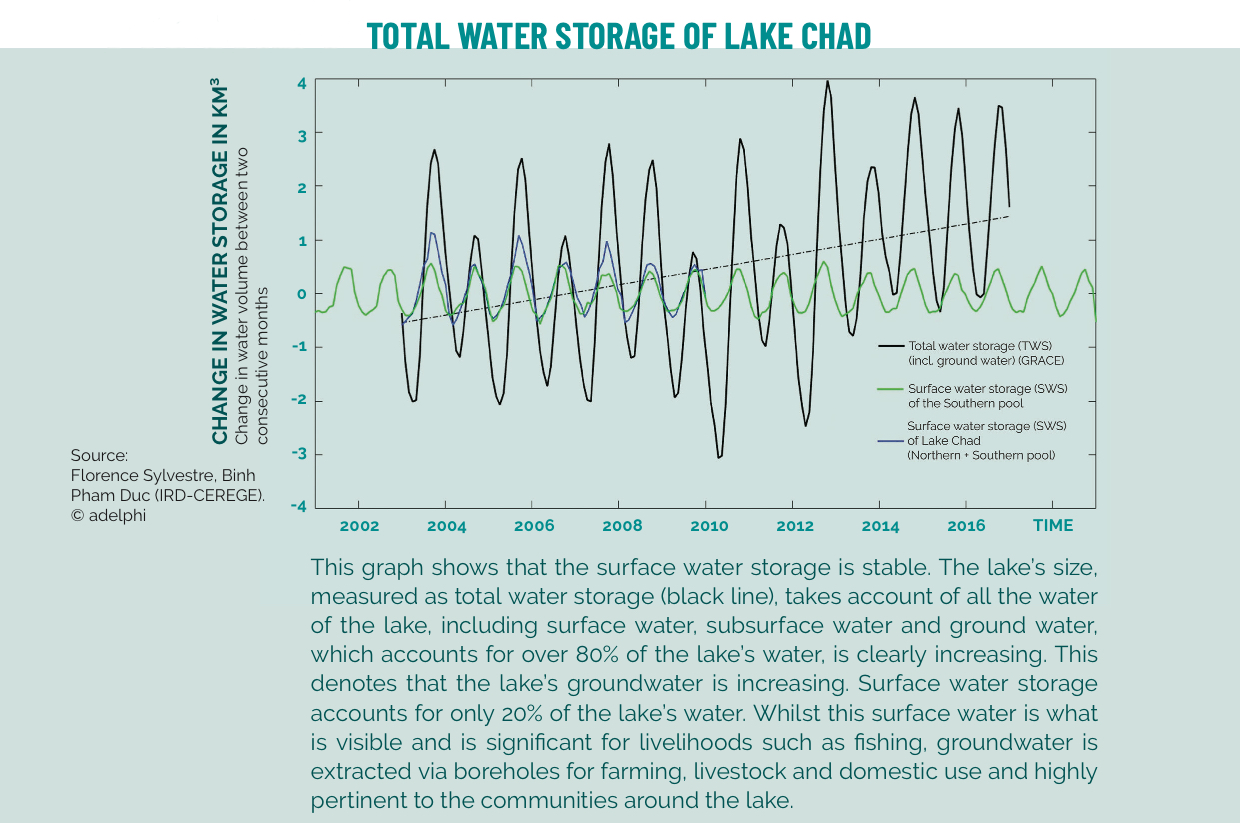
Total water storage of Lake Chad

| DOWNLOAD JPG 554 KB |
This graph shows that the surface water storage is stable. The lake’s size, measured as total water storage (black line), takes account of all the water of the lake, including surface water, subsurface water and ground water, which accounts for over 80% of the lake’s water, is clearly increasing. This denotes that the lake’s groundwater is increasing. Surface water storage accounts for only 20% of the lake’s water. Whilst this surface water is what is visible and is significant for livelihoods such as fishing, groundwater is extracted via boreholes for farming, livestock and domestic use and highly pertinent to the communities around the lake.
SOURCE
- Florence Sylvestre, Binh Pham Duc (IRD-CEREGE)
IDPS and refugees in the Lake Chad region

| DOWNLOAD JPG 635 KB |
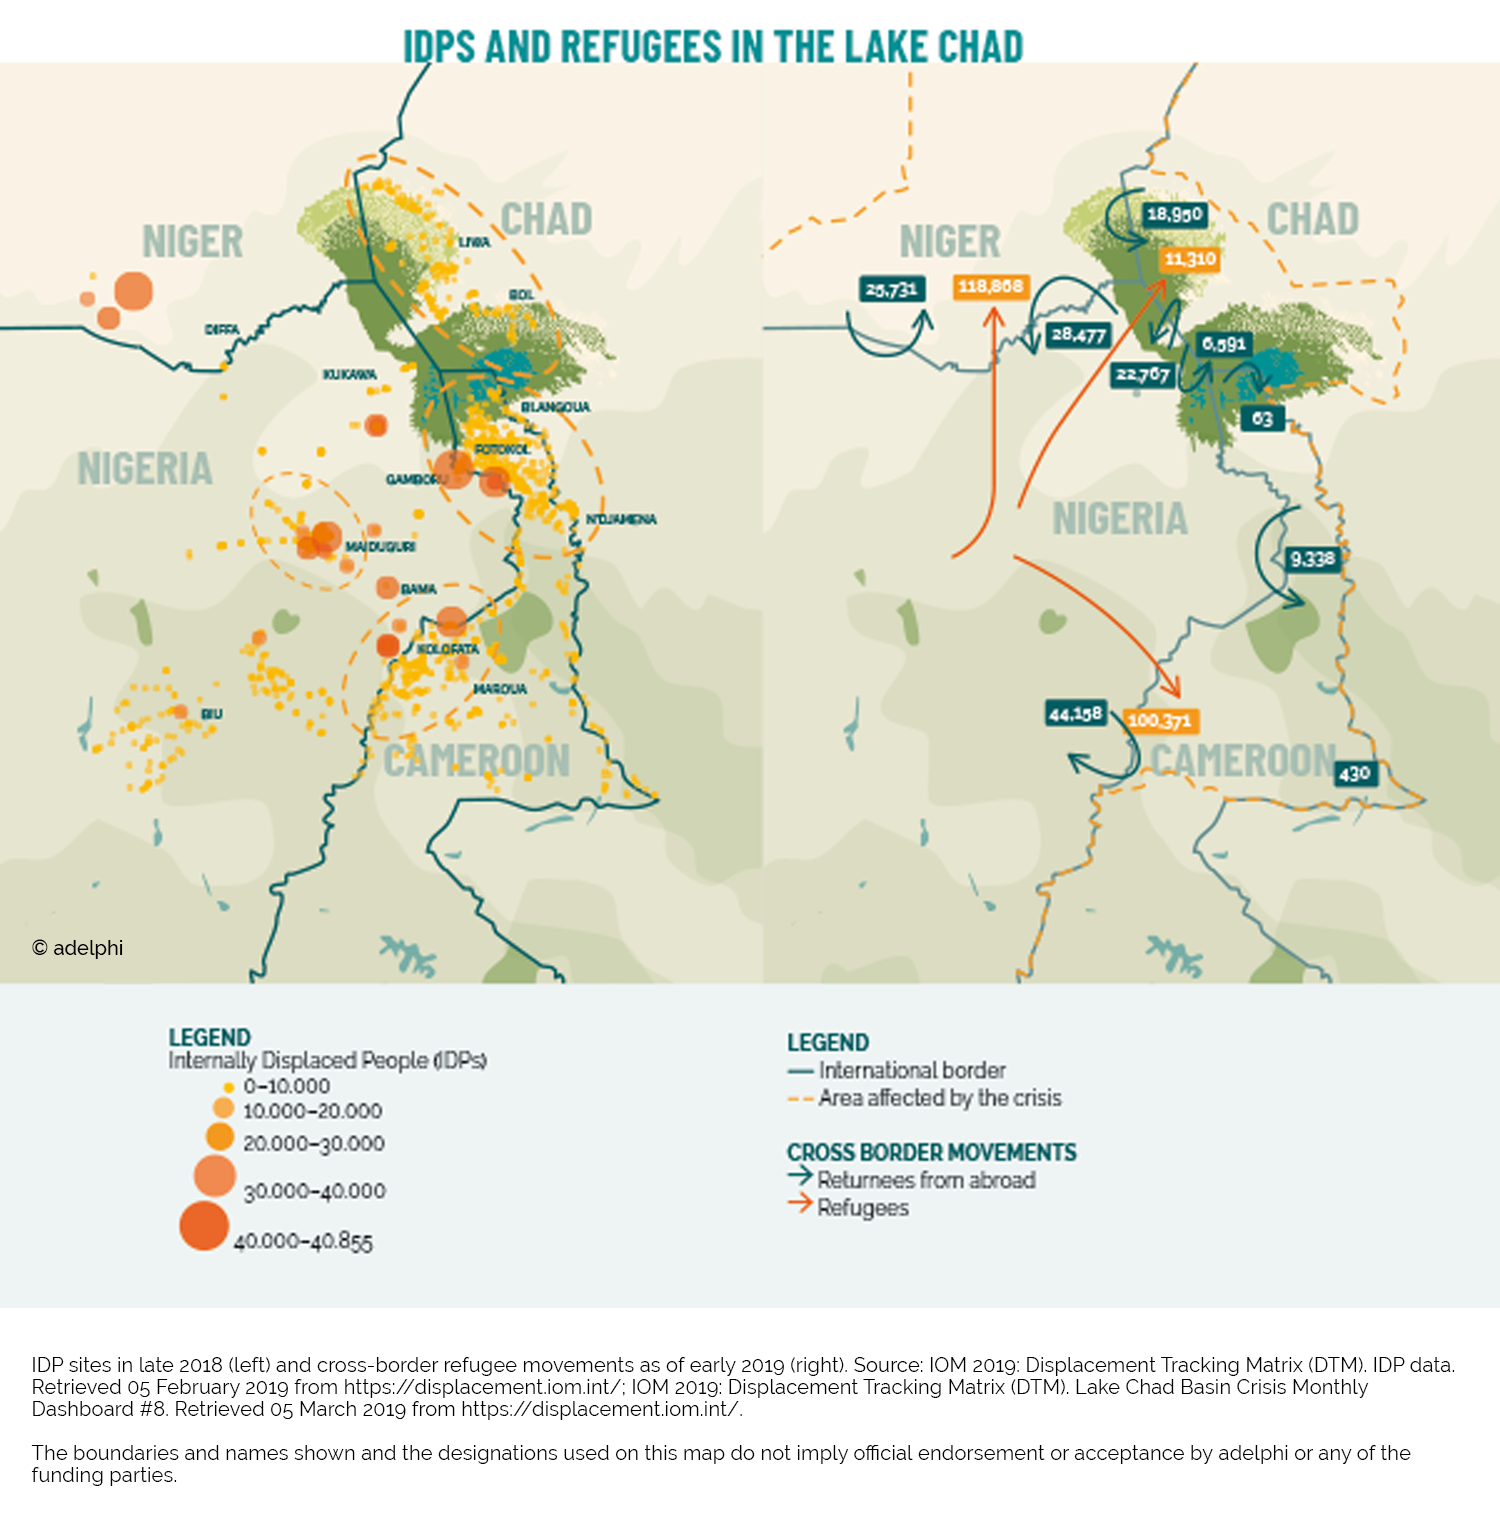
The increase in numbers of internally displaced people (IDPs) has resulted in the clustering of large numbers of people into already resource stressed and/or deficient areas in search of safety. This places significant pressure on locally limited resources and existing resource governance systems, increasing the potential for escalating conflict (see section 2.2). Notably, IPD sites are clustered around Maiduguri (Nigeria), southeast of Maiduguri along the Nigerian-Cameroonian border, in the border region between Gamboru (Nigeria) and N’Djamena (Chad), and to a lesser extent northeast of Lake Chad across the Chadian border.
People have had to leave their homes, leaving behind produce, tools and equipment. Many of them have moved a number of times and their financial capacity to respond and adapt to their changing circumstances has been eroded. Whilst the majority of displaced persons have sought safety within their own country, a considerable number have also fled to neighbouring countries; most notably from Nigeria to Niger and Cameroon and to a lesser extent to Chad. Furthermore, an estimated 157,000 people have moved back and forth between the four countries, with limited possibilities to rebuild an existence.
IDP sites in late 2018 (left) and cross-border refugee movements as of early 2019.
The boundaries and names shown and the designations used on this map do not imply official endorsement or acceptance by adelphi or any of the funding parties.
SOURCE
- IOM 2019: Displacement Tracking Matrix (DTM). IDP data. Retrieved 05 February 2019 from https://displacement.iom.int/
- IOM 2019: Displacement Tracking Matrix (DTM). Lake Chad Basin Crisis Monthly Dashboard #8. Retrieved 05 March 2019 from https://displacement.iom.int/
Restrictions on cross-border movement and trade
| DOWNLOAD JPG 341 KB |
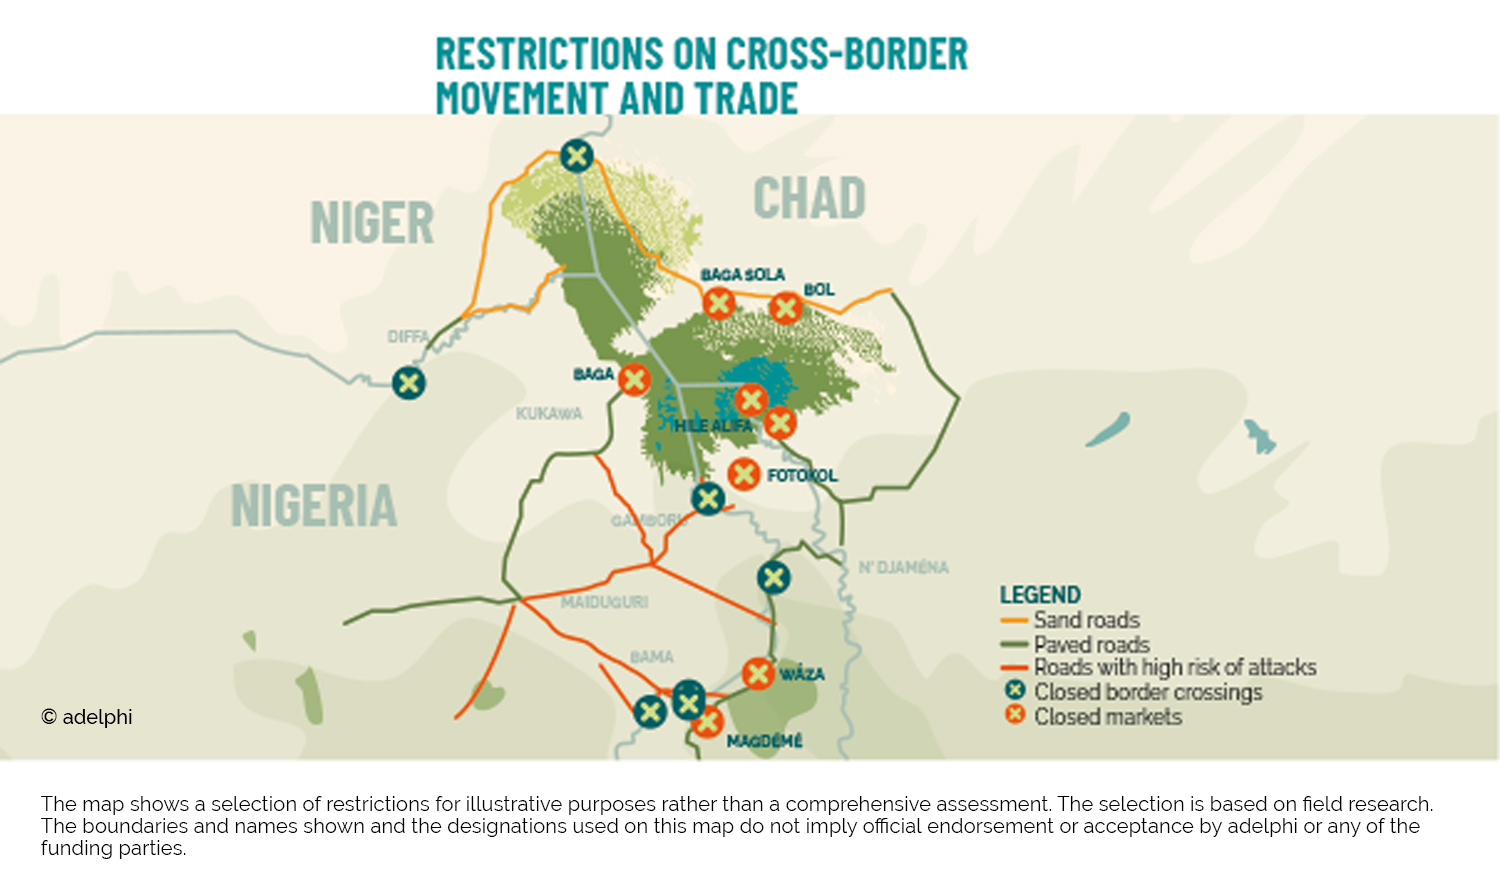
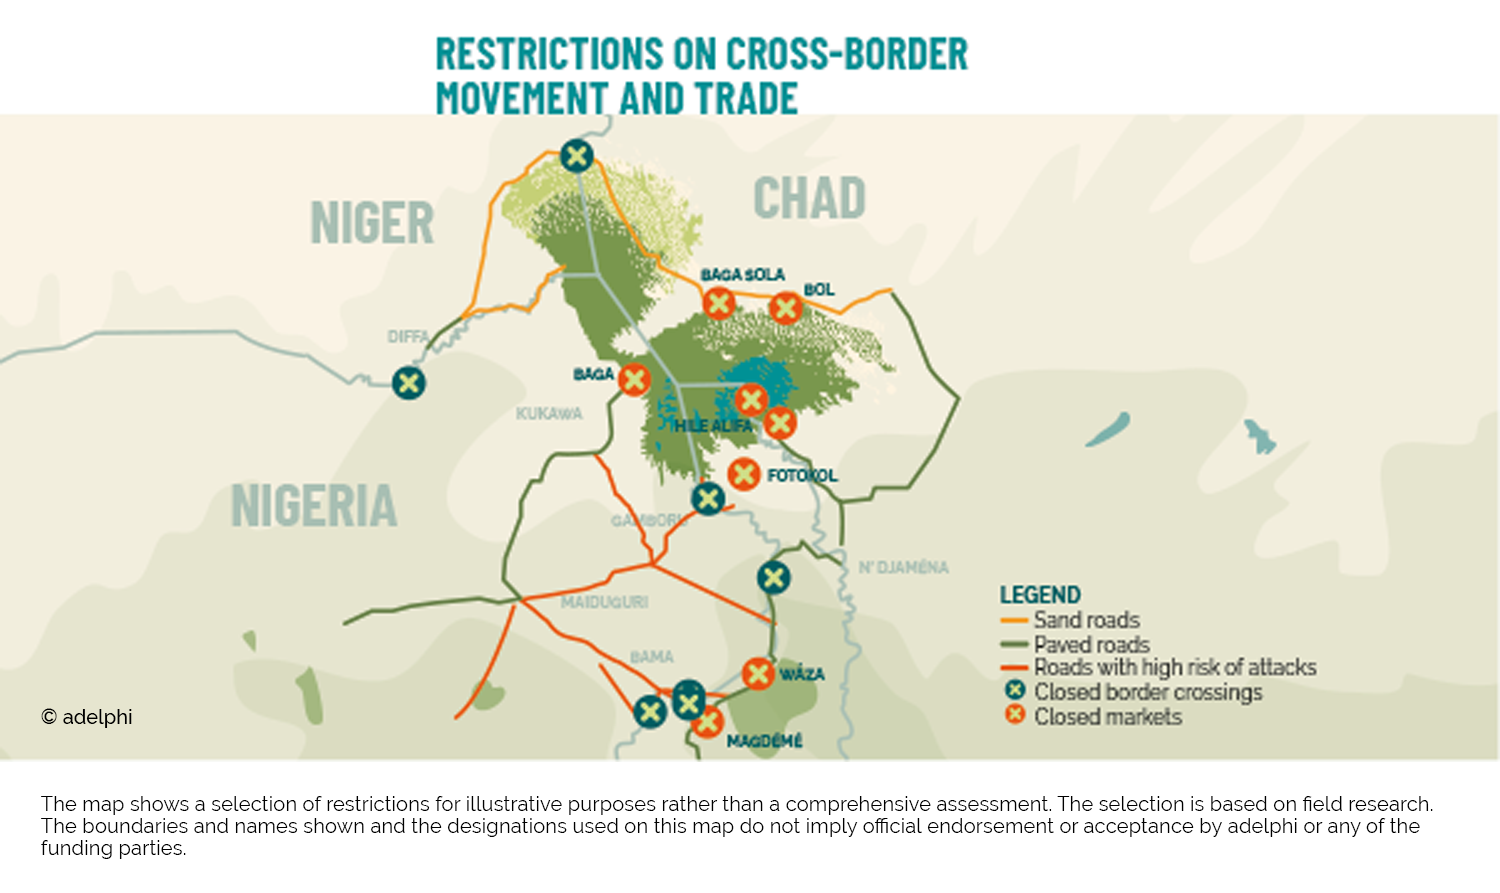
The map shows a selection of restrictions for illustrative purposes rather than a comprehensive assessment. The selection is based on field research.
The boundaries and names shown and the designations used on this map do not imply official endorsement or acceptance by adelphi or any of the funding parties.
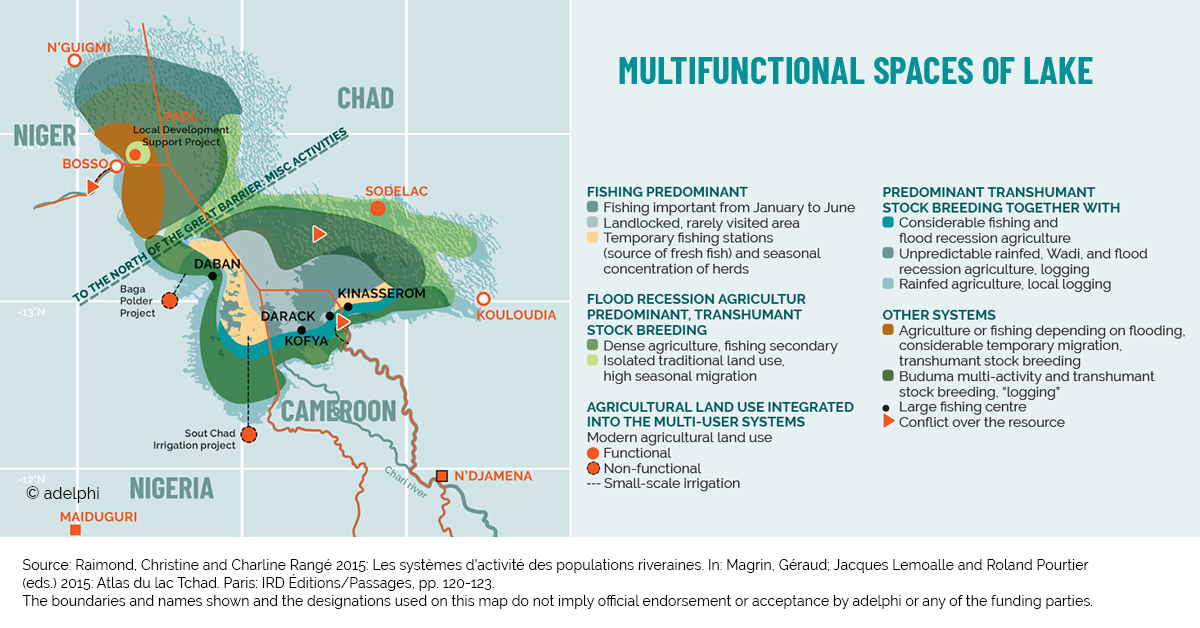
Multifunctional spaces of Lake Chad

| DOWNLOAD JPG 437 KB |
The boundaries and names shown and the designations used on this map do not imply official endorsement or acceptance by adelphi or any of the funding parties.
SOURCE
- Raimond, Christine and Charline Rangé 2015: Les systèmes d’activité des populations riveraines. In: Magrin, Géraud; Jacques Lemoalle and Roland Pourtier (eds.) 2015: Atlas du lac Tchad. Paris: IRD Éditions/Passages, pp. 120-123.